Sunday, December 23, 2012

Holiday Fractions

Word Problems
Eli was celebrating the holidays with her family and was getting ready to pick a piece of cake to share with her friends.  If Eli wanted to get the most cake which part should she take 2/5 of chocolate cake or 3/10 of marble cake?  

Marcus sorted the recycling after a holiday gift exchange.  He found that about 1/4 paper products and 1/3 plastics.  Which type of the recyclables has the greatest amount? 

Opinion
Do you think recycling is a good idea, or do you think it is too expensive?   What are the pros and cons of recycling for you?   

Fractions in review
Here is a sheet on adding and subtracting fractions.  Remember to decide on a common denominator.  Then remember to multiply the numerator and denominator by the same number to make equivalent fractions.  

Create one of your own fraction word problems to share.  Add the answers too:)

Answers:  2/5= 4/10,  so 2/5 is a bigger piece than 3/10
1/4= 25%, 1/3=33%,  1/3 is the greater amont


Tuesday, December 11, 2012

Comparing World Populations

We can use population size to compare different countries in our world.  One way to write large numbers such as population is in scientific notation.  Scientific notation is written as a decimal between 1 and 9 multiplied by a power of 10.
For example the population of Turkey is 79,749,000 people, or as 7.9749 * 10^7 in scientific notation.
The country of Mexico has a population of about 114,975,000 people, or 1.14975 X 10^8.  Mexico has approximately 35 million more people than Turkey.  
Another way to compare populations is to find out the population density.  The population density compares the population to the land area.   For example Turkey has a land area of 769,632 square kilometers. When we divide the population by the land area we find the population density.  The population density tells us how many people live per square kilometer of land.  In Turkey the population density is 79,749,000 people /  769,632 square kilometers = 104 people/square kilometer.  Mexico has about 1,943,945 square kilometers of land, and its population density is 59 people per square kilometer. So, even though the population is less in Turkey, it may feel more crowded because of a higher population density.

Population density is used to compare how crowded places are around the world.  The density of a place might suggest a good place to begin a business, or a good place to advertise a product/service.   Others may think that a place with low population density may be a more peaceful place to live with less noise or traffic congestion.  How do you feel, would you prefer to live in place with a high or low population density?


Use the websites below to explore places in the part of the world you live, or places that interest you.  Here are some questions to include as you explore as you compare world populations. 

  • How do different cities or countries compare in population ? 
  • How would the populations be expressed in Scientific Notation?
  • How does the population density compare between the cities or countries?  


Quiz on Population Density

Here's an example of a Density Chart
Country

Population
(people)
Scientific Notation
(Population)
Land Area
(Square Kilometers)
Population Density
Population ÷Land Area
United States
313,847,000
3.13847 X 10^8
9,161,966
34
Mexico
114,975,000
1.14975 X 10^8
1,943,945
59
Turkey
79,749,000
7.9749 X 10^7
769,632
104
Peru
29,550,000
2.9550 X 10^7
1,279,996
23


By looking at Density I learned about the ratio of people to land area.  It was interesting to me that Turkey had the highest population density of the four countries since Turkey had the second lowest population.
 I think that this high density may be caused by it's smaller land area.  Another thing I noticed was the lowest population density was from Peru who had just 32 people per square kilometer.  The population in Peru is therefore more spread out than the other countries which have a higher density than Turkey.

References
  1. World By Map, http://world.bymap.org/LandArea.html, December 18, 2012
  2. World By Map, http://world.bymap.org/Population.html, December 18, 2012


Friday, December 7, 2012

Geometry and Right Triangles


The diagram of above shows the relationship between the area of the large purple square and the area of the middle tan colored square.  The website Math is Fun tells how how this puzzle fits together.  The right triangles and squares inside the figure create a unique pattern that we use today to find out the length of the sides of right triangles.  

Use this Pythagorean Theorem interactive tool to experiment with how the sum of the squares of the triangle legs is equal to the longest side squared.

Here's a Pythagorean Theorem problem to try. Take a moment also to share your own problem as well.
A ladder stretches from the floor to a shelf diagonally. (c)  The distance from the floor to the base of the ladder is 4 meters (b).  The height of the wall which makes a 90 degree angle with the floor is 3 meters (a).  What is the length of the ladder?

3*3  + 4*4=  ___ * ___

9  + 16  = ___ * ___

25 = ___ * ____           Hint: square root of 25 = ?
How many meters long is the ladder?


Wednesday, November 28, 2012

Translations, Rotations, and Reflections

Coordinate Graphs use ordered pairs to plot different shapes and designs.  One way we use coordinate graphs is to move shapes around to different parts of the graph through translations, rotations, and slides.
This is used in the real world by computer programmers to make models and animations.   

Try your skill at using translations, rotations, and
slides by clicking on this link for a Khan Academy Simulation.  Transformations Computer Practice  

Transformations are a general term that means that things are being moved around in the coordinate graph.  
Here are some terms that you probably know already:  slides, flips, and turns.
  • Slides- when an object is moved without lifting it off the page is a slide.  Another way of saying slide is a translation.  Translations can be found by using an equation like (x + 2, y - 1).  For example, if the original point in an ordered pair (x,y) is (4,1)  then the translation of that point would be (4+2, and 1-1) or  the new point would be at (6,0). 
  • Flips-  another word for a flip is a reflection.  The reflection of the object is when it is "flipped" on the opposite side of the x or y axis.   One way to do the reflection of a shape in an ordered pair (x,y) is to multiply either the x or y by negative 1.   Let's say for instance that we want to flip a point over the x axis. Using point (3, 2) we would multiply the x coordinate 3 by -1.  The new point would be at (-3,2) 
  • Turns-   turning an object around from a center point is yet another way we can move the object.       A Rotation is another name for a turn because there is a center point that remains the same as the shape rotates on 1 point.  Both the size of the figure and the distance between the points remains the same as the figure rotates to different quadrants.                                                                                                                  
Here's a video link that shows how to rotate a quadrilateral 90 degrees and a way to predict where the new points will be on the coordinate graph.  Rotations of 90 Degrees Video

Online Quiz for Transformations: Translations, Reflections, and Rotations.


Friday, November 2, 2012

Electoral Votes and the United States Election

270 electoral votes are needed to win the presidential election.  What are some different ways that the states' electoral votes could be combined to equal the 270 votes?

For example, using the chart of electoral votes by state some of the top states that would sum up to 270 include: California  55, Pennsylvania 20, New York 29, Florida 29, Michigan 16, Texas 38, Illinois 20, North Carolina  15, Georgia 16, Minnesota 10. Washington 12. and Wisconsin 10.  

The map of electoral votes state by state shows who's in the lead in each state going into election week.
What different combinations of electoral votes would give your candidate the 270 votes needed to win?
If you were running for president in which states would you want to spend your resources?

270 votes is what percent of the total 548 votes needed to win the election?


Friday, October 26, 2012

How can we divide it?


Diagrams like number lines and animations help us show and explain real life situations.  

Websites: 
Interactive number line investigates making equivalent fractions and finding common multiples.  

Math Animation explores finding out how to sort markers and video game prizes into paper bags.

Problems:
1.  If x=5 and y=3 prove that:

6x  - 5 =  5
y

3y-x +9 = 18-5

2. There are two kinds of breakfast bags that are served: Hot or Cold.  If there were 18 hot breakfasts and 27 cold breakfasts available one day,  How boxes of the hot and cold breakfasts could be made that each have the same amount of hot and cold breakfasts?

Hint:  What are the common factors of 18 and 27?
 ____, ____, _____,
 ____, ____, _____

Tuesday, September 18, 2012

Make Sense of Data and Communicate the Findings


The famous saying, "A Picture is Worth a Thousand Words" by French leader Napoleon Bonaparte is true when we use graphs to show data.  A decision that mathematicians often need to make is what type of average best represents the data set.  The box and whisker plot graph can show whether the data points are close together or spread far apart.  Here are some things to look for when making sense of a box and whisker plot:
  • It displays the range of the data set from the smallest number to the largest (The whiskers of the graph-  from 50 to 93)
  • The Median, or middle number (79 in the example) shows that 50% of the data is above (79) and 50% is below the median (79)  
  • A Lower and Upper Quartile, or median between the median and the upper/lower values shows how the data fits into four groups each having 25% of the data. (The box stretches from the low to upper Quartiles- from lower quart 69 to upper quart 86)
To review watch this Khan Academy video of how to create a Box and Whisker Plot from a set of data. 


  1. What strategy does the video use to find the median?  Do you find this to be helpful, why or why not?                                                                                                                                                                        
  2. The Box and Whisker Plot uses a number line and a scale to plot points on the graph.  The video shows two different scales for the Box and Whisker Plot.  Which scale makes more sense for the data in the video, Going from 0-100 counting by 10's, or going from 45-67 counting by ones?  
  3. What kind of average would be best to use with the data in this video?  
  4. Where do we use Box and Whisker plots in real life?  Share an example of some data that could be displayed in a box and whisker plot.


Friday, August 10, 2012

Numbers at the Summer Olympics

  Every four years an Olympiad takes place. This year's 2012 Summer Olympic Games showcases amazing feats, national pride, and a rich historical tradition.
  Statistics help people compare the athletes' tremedous skill and quantify the magnitude of their talents! Each olympic event brings an unique set of skills and precise measures of finding true greatness. The numbers that shine on the display boards arrive with an advanced precision with help from technology. The website "How Stuff Works" includes the picture below that details how the speed is found for a racing event.
  London, England is the host city for the 2012 Summer Olympics. Countries bring their flags, fans, and ambassadors to London to cheer on their athletes. I think that the pride in bringing back a gold medal or simply representing their country in an event stirs up Olympic-sized emotions.
  Links to the Numbers
  How expensive is it to host a 2012 Summer Olympics? London Out Loud
  Who's in the lead for the total medals won? Medal Tracker
  What is the hometown of USA Women's Soccer Champion Amy LePeilbet? NBC Local Athletes

Tuesday, July 3, 2012

Scale Drawings & Double Number Lines

Have you ever tried reorganizing your room and used a scale drawing to try out different arrangements?
The double number line is one way to figure out the proportion of the actual size compared to the scale size.   As shown in the number line the equivalence of the sizes is shown in fraction form, or on opposite sides of the number line.  The larger measurement is on the bottom and the smaller measurement is on top.  In the problem below a room has a width of 3 meters and a length of 2.6 meters.  One way to scale this down would be to convert 3 meters into 300 cm, and then divide 300 cm. by 20 to get 15 cm.

0                                  5                                  10                                15
________________________________________________________

0                                  100                              200                              300
The furniture in the chart can be converted from its actual size to a scale size by using the double number line. Another strategy is simply to use the equation for the rate.
(Actual Size ÷ 20 = Scale Size) Try to find the scale measurements for the furniture in the chart. Here’s a video link on Scale Helicopters from Khan Academy.
Enjoy :)

Furniture
Actual
width/length
(cm)
Scale
width/length  (cm)
Dresser
      80 cm / 30 cm
Chair
      50 cm  / 50 cm
Bed
     100 cm /170 cm
Desk
     110 cm / 60 cm

Friday, June 15, 2012

Summer Reading

I just finished reading "A Long Walk to Water" by, Linda Sue Park.
This gripping narrative delves into the lives of two Sudanese children who are dealing with civil unrest and a struggle for their own survival.   The main characters stories intertwine in the chapters and have a common thread throughout the captivating story.  As I read the story I was left to contemplate how courageous and self-less people are in meeting life's challenges.  This style of this story reminds me of Linda Sue Park's earlier novel, "When My Name Was Keoko" which also has two young adult narrators, one boy and one girl.   This style that
Park uses in her novels makes the books fascinating with connections between
characters and great cliff hangers to keep you wondering what will happen next.

You can take action to help support the Sudan region at Salva Dut's webpage http://www.waterforsouthsudan.org/ 
If you'd like to find out more about the books you can begin by looking at 
Long Walk to Water
When My Name Was Keoko

If you'd like to to use your iPod or MP3 to listen to book recommendations a helpful podcast comes out each month at Text Messages: Book Recommendations for Young Readers

What are some favorite books you would recommend for summer reading?
Some books I heard on Text Messages that I think I'll try out are
 "Divergent", By Veronica Roth
"Where Things Come Back" by, John Corey Whaley, and
 "A Monster Calls" by, Patrick Ness

Enjoy!

Thursday, June 7, 2012

Music and Rhyme Patterns

Music often follows a rhyme pattern.  Take the last word in a line as your rhyming word and on an regular interval it rhymes with the last word in another line.
A song pattern can go a, a, b, a, b where the last word of line a rhymes with all of the a lines, and the last word of the b lines also rhyme.  Norah Jones song, Shoot the Moon fits this pattern. This is from http://www.poemhunter.com/song/shoot-the-moon/

a   The summer days are gone to soon
a   You shoot the moon
b   And miss completely
a   And now your left to face the gloom
c   The empty room which smelled so sweetly
c   Of all the flowers you plucked if only
d   You knew the reason
c   Why you had to be so lonely
d   Was it just the season?

e  The Fall is here again
e  You can't begin to give in
f   It's all over

g  When the snow comes rolling through
f  Your rolling too with some new lover
h  Will you think of times you told me
d  That you knew the reason
h  Why we had to each be so lonely
d  It was just the season

This song makes me think of changes in life, like the changes in season.  At different points in life people choose to go their separate ways.  I think 'shoot the moon' means try very hard, or go all out for someone.  Norah's song has a sad tone that I can relate to, but also seems to have a hopeful message as well. Here's a video link that has the song-   Norah Jones Shoot the Moon.

Are there rhyming words in songs you know?  Share a favorite song, or check out the website, Rhyme in Lyrics for more information about rhyme patterns.  http://www.musiclyricsfyi.com/rhyme-in-lyrics.html

Saturday, June 2, 2012

Metric Measurement on Graphs!


What is the relationship between different systems of measurement?  By looking at graphs and data patterns we can learn how the systems of measurement are related.  Temperature is a measurement system that affects us all every day, and 8th graders at Swift began to look at switching back and forth between Celsius and Fahrenheit scales.
Fahrenheit and Celsius temperatures scales were originally based on the freezing and boiling points of water.
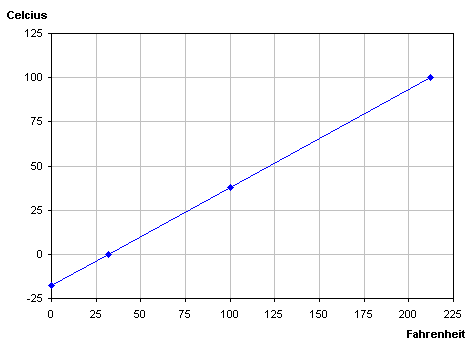
On the graph below we can find the freezing and boiling point for water in both systems. The coordinates for these points are (32, 0) for the freezing point and (212,100) for the boiling point.  When finding the slope or rate of this line we calculate (y2-y1) / (x2-x1), or the rise over run.  
(212-32=180) / (100-0=100)
     180 / 100 = 1.8
The slope can be written as the decimal 1.8, or as a fraction, 9/5 (in simplest form).
  • Ready to try out your skill at finding patterns in graphs?  Go to Math-play.com for interactive games. 
The temperature graph below can be used to generate an equation for converting Celsius to Fahrenheit.
It shows that the starting point for Fahrenheit is 32 degrees, the point at which water begins to freeze.  So, the number 32 can be added to the product of Celsius times 1.8 to find out the degrees Fahrenheit.  This equation fits into the slope intercept form;  y= mx + b,  F=1.8*C + 32   F= Fahrenheit, C= Celsius.
                             
For example, if the temperature is 25 degrees Celsius, what is the temperature in degrees Fahrenheit?
F=Fahrenheit and C= Celsius     F= 1.8 * C  + 32
                                                 F=  1.8 * 25 + 32
                                                 F=  45 +32
                                                 F=  77 degrees    So, 25 degrees Celsius  =  77 degrees Fahrenheit

Another pattern in measurement involves different systems in measuring distance, Miles and Kilometers.
The relationship between miles and kilometers is similar because for every 1 mile we use a slope of  .621 kilometers. In an equation we can write k=.621*m  (k= # of kilometers, m= # of miles)

If a family traveled in a car 36 kilometers, how many miles did it travel to its destination?
k= Kilometers and m= miles    k = .621*m
                                              36 = .621*m
                                        36 /.621 = about 57.97 miles    So, 36 kilometers equals about 58 miles.

Since both of these measurement patterns are written in slope-intercept form it is helpful to put them in graphic form, by using an online graphing calculator.  The graph below is the equation  y=.621* x  in graph form.  Even though the graph shows negative integers for x and y values, since we are figuring out distance the values that are useful are those that begin at zero and have positive values.   

  • Practice Game: Use slope intercept form to make an online graph.  1) Create a table of values to solve for x and y.  2) Then, move the graphing position to create a line that matches your data points.

Monday, May 21, 2012

Geometry Review

A line has an angle measurement of 180 degrees.  In math, supplementary angles are angles that add up to 180 degrees.
The picture to the right has us Compare Angles from two parallel lines, OQR and PTS, cut by a traversal line NQT   The following vocabulary words are things we can review from this drawing.
1. Alternate interior angles are highlighted in between the parallel lines.  These angles are on opposite sides and when their angle measures are combined they add up to 180 degrees.  For example the yellow angles are shown to be congruent to one another in the diagram above. 
2. Cooresponding angles are add up to 180 degrees and are on the same side of the traversal.   the interior angle on the same side are congruent.  In the diagram angle Q is congruent to the blue angles. 
3. Adjacent angles are angles that are next to another and sum up to 180 degrees in the figure.  Angle T and the yellow angle next to it are adjacent angles. 
4. Vertical Angles are formed by the same parallel line and are not adjacent.  Angle T and the blue angle across from it are vertical angles.  Vertical angles do not add up to 180 degrees.

Vocabulary and Comparing Angles Practice at http://www.ixl.com/math/grade-7/transversal-of-parallel-lines

Saturday, May 12, 2012

Graphing Calculators and Problem Solving


A highlight of student work this week was using the Slope-Intercept make equations, find patterns in data, and create scatter plot graphs.  It was also neat to see how students began to think of solving a system of equations using graphs of the equations:
y=.49x +10
y=.99x
Students found that the graphing calculator tool, meta-calculator.com, produced quick and accurate results. 

The solution to the 2 equations above is the point where the lines intersect.  This point is at approximately (20,20).   So, how does this graph help answer last week's Music Download word problem? 
Our definition for the variables... x= the number of songs, and the variable y= the cost of the songs.
We discovered that ...When 20 songs are purchased the price of the 2 plans happens to be the same. (around $20).
Therefore...When more than 20 songs are purchased the first plan is a better deal, when less than 20 songs are purchased the 2nd plan is cheaper.

Use the graphing calculator application to solve this problem: What solution do you find for the system of equations?
 y= -3x+2
 y= 2x-3
How would you check to make sure this solution is correct?
Find more interactive practice problems with answers at http://regentsprep.org/REgents/math/ALGEBRA/AE3/PracGr.htm

Friday, May 4, 2012

Slope Fits into Equations

How do we solve problems that involve changing costs, or other things that are in flux in our world?  In Math equations are used to figure out all the possible scenarios that may occur.  The equation y=mx+b shows a linear pattern that can be drawn on a graph or put into a table. 
This week in Middle School we wanted to purchase several items that cost the same amount.  The cost of each item was then multiplied by the # of items that we wanted to buy.  This cost is called the slope, or the rate of each item.  If we had a delivery fee, or other fixed cost that was included we had to add this to the equation too.  When making a decision it is helpful to use the slope-intercept equation to explore the cost.

Here's a problem to get started thinking about how slope fits into real life problem solving...
Musicmatch, an online music store, charges a $10 dollar membership fee plus $.50 cents per song. i Tunes sells songs for $.99 cents each, but doesn't
charge a membership fee. 
Which company offers a better deal for the music lover?
Set up an equation in slope intercept form
that can be used to find the cost for any number of songs.
 
The following website offers consumer reviews of different online music companies that may be an even better deal. Check them out at Music Download Reviews.

First we begin by comparing each music plan.  In looking at the problem, What things could change as a person begins using each plan?  We should be able to find two variables that can be represented by x and y in the problem.

After we have found the variables we look at the cost of each song.   This unit cost, or slope is represented by the letter m in the slope-intercept equation. (y= mx+b)  Slope is also called the unit cost, or rate of change.  When setting up the equation we use slope to show the rate of increase or decrease.  Slope is also how fast the rate increases or decreases.  An interesting observation that students made while graphing lines on a coordinate plane was the steeper the line the greater the number of the slope.  Can you identify what the slope is for the different music plans?
If not, or for more about the slope click on this hyperlink--- The slope.

The Y-Intercept on a graph shows where the line crosses the y-axis.  In problem solving this can be also expressed as a fixed cost or starting point for how much a person would pay up front.  For example, if a club has a membership fee that must be paid in addition to buying songs. For example, if i tunes had charged a $5.00 membership fee this would be added on to the equation.  y=.99x + 5  Can you tell what the y-intercept for Musicmatch would be?  Does i Tunes have a Y-intercept, why or why not?

The slope and y-intercept are written in Slope Intercept Form. (y=mx+b)  As we try different values and put them in for the x=#of songs, or y=total cost, we can further explore the advantages of each music plan.
Which plan did you find to be the better deal for the music lover?  What other strategies can use to solve this problem?

I found it interesting to explore music plans that are available online.  It would be great to hear about other plans that are advantageous, or other links that would give data to support this inquiry.

Wednesday, May 2, 2012

Aladdin Jr and Algebra Word Problems

Swift School is putting on a musical performance entitled, "Aladdin Jr" next week, and we are expecting many children and adults to attend.  The ticket counters at the play will surely be wondering how many adults and children attended Aladdin Jr.  I found a similar question about "Theater tickets" that a student posted on http://www.algebra.com/

Try reading the question and solving it on your own before reading through the solution.  Check your answer with the one shown below. 
What other strategies do you know to solve this problem?  


Friday, April 20, 2012

Sumdog Stats! Math Challenge Update

Statistics is an area of Math that centers on data collection, presentation, and analysis.  For example, the data from Sumdog.com Math Competitions show how Swift Middle School Homerooms' compare.  Room 312 has set a goal of 55,000 points by 4-30, do you think that they'll reach their goal given the data shown below?  The Math competition also shows room 313 in 1st place for the Fall Competition, will they be able to regain the lead in the Spring?   Room 315 has set a goal of 30,000 points, is this goal attainable?

One popular game on Sumdog.com is "Junk Pile"- the game pictured on the logo above:)  If you haven't tried out the games on this free web site, why not give it a try?! 

Spring 2012 Spring Math Competition            Overall Totals for Fall and Spring
Homeroom     Total Points 4-30-12      Rooms   Total Points   Percent
312                   43,221                                       312         55,937            57%
313                     7,632                                        313        30,160            32%
314                     2,218                                        315         7,370               8%
315                     5,242                                        314         3,052               3%
Total                  55,122                                 Total       96,519            100%


Fall 2011 Sumdog Math Competition
Homeroom        Final Points 
313                     22,528
312                     12,716
315                      2,128
314                         834
Total                   38,206

Monday, April 16, 2012

Compare the Surface Area

The area that covers the outside of a figure is its surface area.   Surface area can be compared to wrapping a present or covering the outside of the object with paper. 

The interactive tool at Annenbeg's web page shows how to find the surface area of cylinders and prisms.  The surface area is the sum of 2 ends of the cylinder and the middle section.
Middle= Circumference * height  +  Ends (2 * Area)
Which container below has the greater surface area, and how much more area?
How would you verify and make sure that both containers have a volume of 750ml?

Tuesday, February 28, 2012

How Tall is That? Using Similar Triangles

The figure above shows a problem of: How tall is the flagpole?  Our 8th grade Math investigation showed a way to find out the height of a cliff using similar triangles like the ones pictured above.  It is important to remember that similar figures share corresponding sides and corresponding angles.  Corresponding angles have equal measures, while corresponding sides have the same ratio.  In the picture above, the corresponding sides on the base of the similar triangles show a ratio of 15.5/4 which equals 3.875

Several eighth graders discovered a strategy to figure out the missing side by using the ratio multiplied by the corresponding side.  For example if we wanted to find the height of the flag pole, this strategy says we take 3.875 times 3, which gives the height of 11.625.  

If you want to find out more about how to use this method to find the height of familiar objects, such as skyscrapers, trees, or towers check out the website Connecting Geometry   
Another fun pair of links to sharpen your math skills are Math Videos at Khan Academy.  Check out the video links below and more great videos on Khan Academy.

Sunday, February 19, 2012

Interactive Integer Flash Cards and Slope Practice

Try your skill at integer operations.  Solve the integer operations flash cards.  Check your answer by clicking the card after you solve the problem.  Then move the flash card to the correct or incorrect pile.  Try again and see how many you can get correct. 
Afterwards, add a comment below and some strategies you like to use for solving integer operations. 


More flashcards and educational activitites at StudyStack.com

Click on the Link Below to practice finding the slope of a line
Interactive slope of a line from Mathwarehouse.com

Thursday, February 2, 2012

Popcorn Friday's: 8th Grade Fundraising

Eighth grade graduation fundraising has involved the business minded skills of the students selling taffy apples, buttons, and popcorn.   The sales will off set some of the costs for eighth grade graduation activities.  Students show teamwork by working together towards their goal of reducing graduation costs.  Friday popcorn sales involve the students measuring ingredients, collecting money, keeping records of sales, and problem solving for optimal sales each week.

What are some ways that math is used as students help manage a fundraiser?  Problems and questions often surface when we are popping away, or looking back at the figures.  For example, this week sales of popcorn were a total of $146 dollars combined between the early morning and afternoon shifts.  The first shift sold ten dollars more than the second shift.  How much money did each of the shifts make during their sales? 

The overall sales of shift 1 (x) and shift (2) y, equalled 146 dollars.   The equation is expressed as x+y=146
Another part of this problem involves the money earned by the second shift. y= x+10.
Solving a pair of equations can be done by solving for x algebraically, using guess and check, or a host of other strategies.  The equation way will substitute the second equation into the first equation.  Namely, x+(x+10)=146.   2x=136, x=68.   Then if x=68, y+68=146.  So y=$78.  Check involves 78+68= 146. 

The math involved in figuring out this equation likely relates to other situations or questions that have come up in managing events like a fundraising.  It'd be great to hear from you.  Share some ways that you have seen math being used.

Sunday, January 29, 2012

Contest Winners and Graphing Links

Congratulations to all the participants of the Sumdog.com Winter Challenge! 
The top 10 winners were...
10  Devon
9  Alvaro
8  Elma
7  Medina
6  Victor
5  Edin
4  Priscila
The top 3 winners were...
3  Neerida
2  Luis
1 Amir

Here are some math links to check out, enjoy!
Compare quadratic function graphs: -5x^2 + -5x + 5
How do I simplify an expression like 3x + 2 + 4x - 2y - 1?
Free Graphing Calculator

Wednesday, January 11, 2012

Advertisements and Percents of Change

Is this the best deal?  What discounts are being offered?   The advertisements online and in print are full of discounts that can be beneficial to savy shoppers.  
For example, Target's website shows discounted prices on movies.   http://www.target.com/sb/entertainment-movies/-/N-5xsx0Z5zktyZ5zja2.  One movie that is adverstised is Harry Potter and the Deathly Hallows.  The original price is shown as $28.98, and the sale price is $12.99.  This can be estimated to be a 3/5 or 60% decrease in price.  The prices listed on the webpage make it is easy to find the percent decrease.  What other percent decreases are there on DVD's at Target?  Is there a better deal (more than 60% off DVD's at Target?  One way to find out is to compare the percent change.
If you'd like to learn more about percent change and spend some time playing a computer game, here's a weblink from The Percent Shopping Game.
http://www.mathplayground.com/percent_shopping.html